
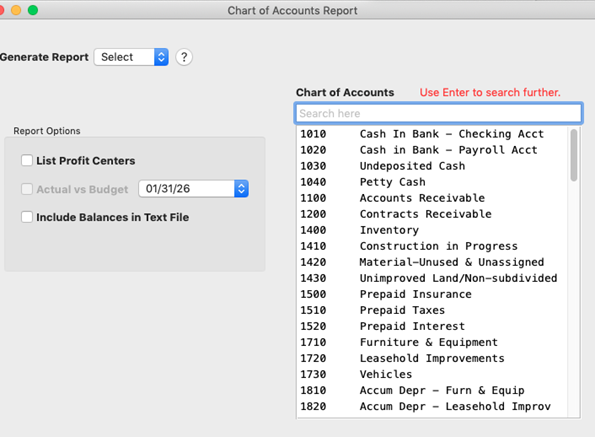
In MultiLedger, the Chart of Accounts report window offers the following options:
● Print a list of your chart of accounts.
● Print or view a graph showing period comparisons.
● Print or view a graph showing account balances versus budget amounts.
Note: If you want to look at account balances for a specific period, see the Trial Balance Report.
Creating Chart of Accounts Report
1. Click Account Reports in the Command Center.
2. Select one or more accounts
3. Choose one of the following:
● Print: Print the full Chart of Accounts
● Graph: View account balances graphically
● Print Graph: Print the graph
Note: When you first open the Chart of Accounts window, the Graph and Print Graph will not display in the dropdown list. Once you select the Accounts from the list it will show in the dropdown list.
Printing Your Chart of Accounts
1. Select Print from the dropdown list to print your chart of accounts.
You can print a list of the chart of accounts showing account numbers and names grouped under headings. All accounts, regardless of any highlighted accounts, are reported.
To change account descriptions, see Setting Up the Chart of Accounts. To change account groupings or group descriptions, see Customizing Financial Statements.
2. A standard print dialog box appears on your screen.
3. Select the print options that you want, and click Print or OK.
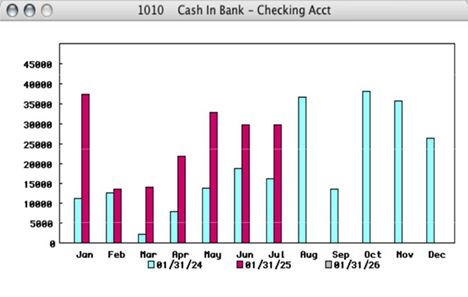
Graphing Comparisons
You can print or view a bar graph comparing a balance for an account or a range of accounts for each period in the open accounting periods.
1. Select the account or accounts to be reported.
If necessary, scroll the list box to find the name of the account or accounts.
You can select a consecutive series of accounts (for details, see Making Selections in a Reports List).
2. Click Graph or Print Graph.
If you click Graph, the report appears on your screen.
If you click Print Graph, a standard Print dialog box appears on your screen. Select the print options that you want, and then click OK or Print.
Here’s an example graph showing a cash account’s comparative balances:
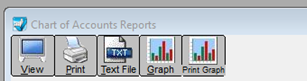
Note: In 32-bit applications, the View, Print, Text File, Graph, and Print Graph buttons are available directly on the screen.
Graphing Account Balances Versus Budget Amounts
If budget amounts have been set up for your chart of accounts, you can print or view a bar graph comparing a balance for an account or a range of accounts for each period versus budget amounts in the open accounting periods.
To set up budget amounts, see Setting Up Budget Amounts.
1. Select the account or accounts to be reported.
If necessary, scroll the list to find the name or names of the account or accounts that you want. You can select a consecutive series of accounts (for details, see Making Selections in a Reports List).
2. Check the Actual vs Budget check box.
3. Select the year.
4. Click Graph or Print Graph.
Related Articles
How to Create Trial Balance Report
How to Create Transaction Journals Reports
How to Create General Ledger Report
How to Create Balance Sheet Report
How to Create Income Statement Report
How to Create Cash Flow Reports
How to Create Financial Snapshot Reports
How to Create Sales Tax Reports